Decoding the Mysteries of the Eye Chart
Have you ever wondered about the eye chart hanging in your optometrist’s office? Known usually as the Snellen chart, it’s not just a random collection of letters. Understanding how it works can provide valuable insights into your vision health. Let’s demystify the eye chart and explore what those letters on the wall truly mean for your eyesight.
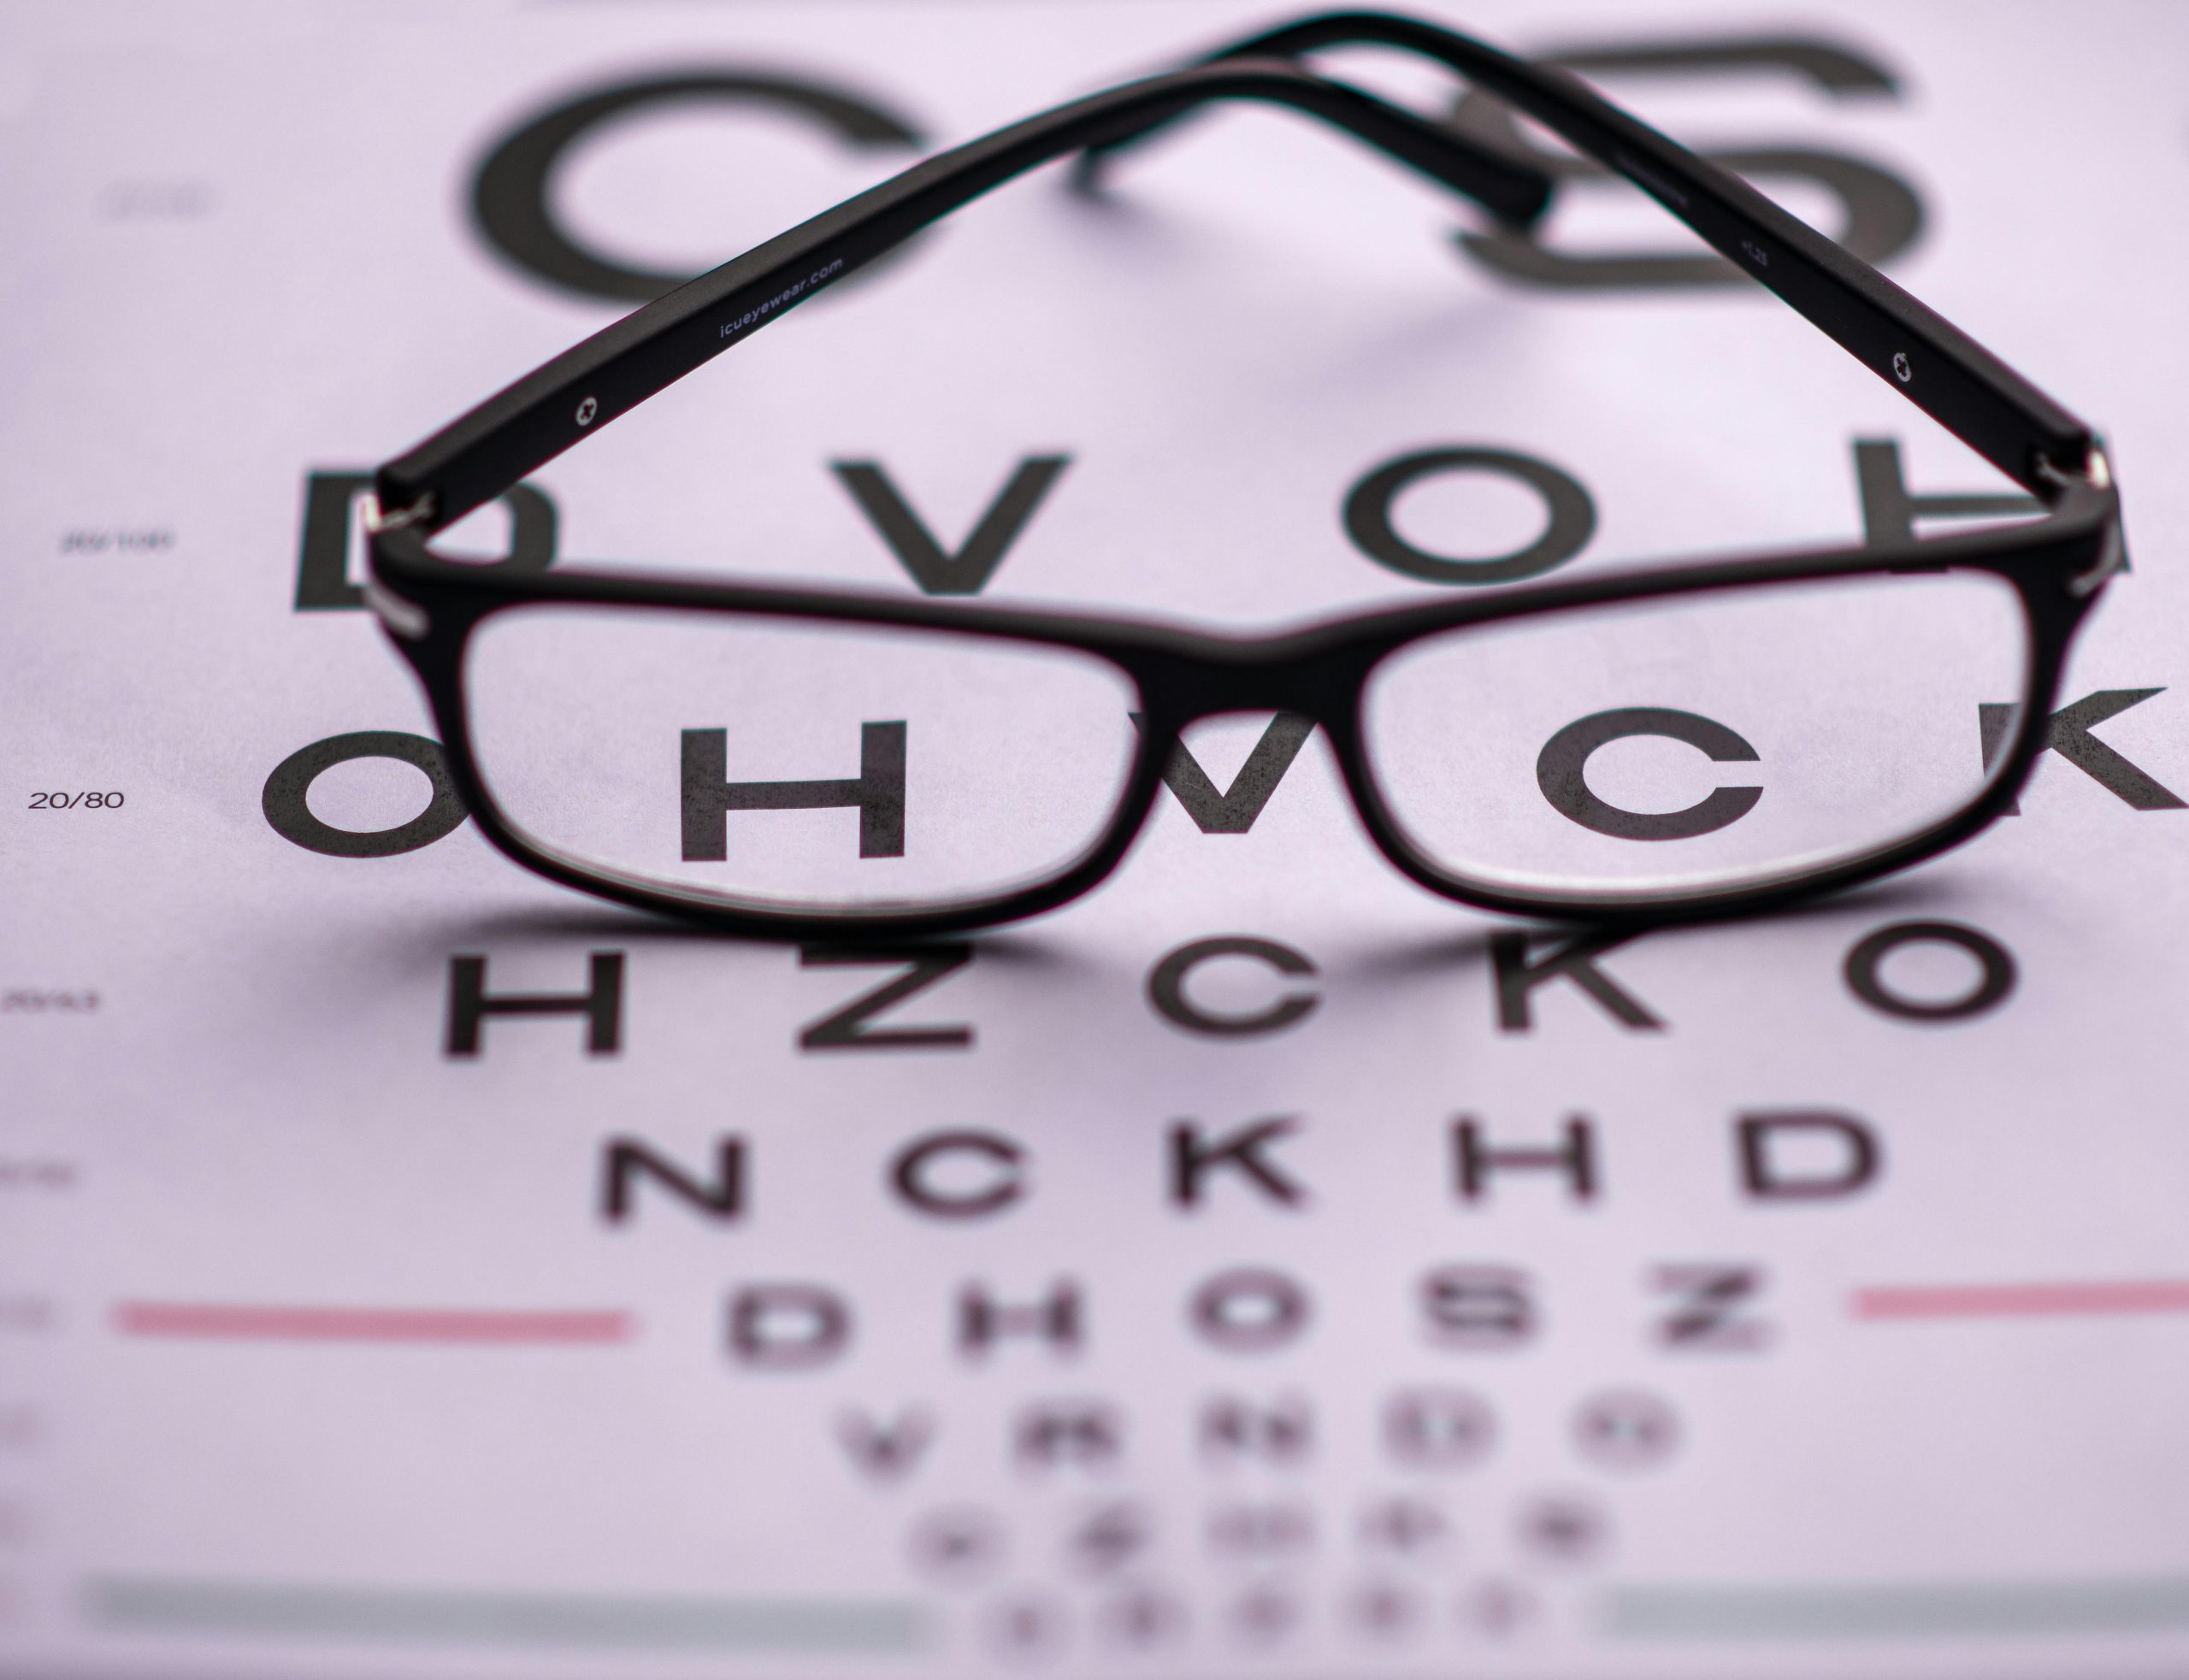
Origins and Purpose of the Eye Chart
The eye chart was created by Dutch ophthalmologist Herman Snellen in the 1860s. The chart is used by eye care professionals worldwide to evaluate visual acuity, which is a measure of how well you can see. It’s an essential tool in diagnosing vision problems and determining the correct prescription for your glasses.
Understanding Visual Acuity
The term “20/20 vision” is a common phrase that many people have heard, but what exactly does it mean? It’s all about visual acuity. Here’s a simple breakdown:
- 20/20 Vision: This is what is often referred to as “normal” vision. If you have 20/20 vision, it means you can see clearly at 20 feet what should normally be seen at that distance.
- 20/40 Vision: If you have 20/40 vision, it means that you need to be as close as 20 feet to see what a person with normal vision can see at 40 feet.
- 20/200 Vision: This is the cutoff for legal blindness in the United States. If your vision is 20/200, you need to be as close as 20 feet to see what a person with normal vision can see at 200 feet.
When your eye care professional mentions these numbers, they’re referencing your visual acuity as measured by the eye chart.
What Does the Eye Chart Test?

The eye chart isn’t just about testing how far you can see. It’s also used to assess other aspects of your vision:
- Refraction: This is the eye’s ability to bend light so that an image is focused on the retina. If you have a refractive error, light rays do not refract properly, causing blurred vision. This is often corrected with glasses or contact lenses.
- Visual Field: This refers to the total area in which objects can be seen in the side (peripheral) vision while you focus your eyes on a central point. Some conditions, like glaucoma, can affect your visual field.
- Color Vision: Some people have a color vision deficiency, commonly known as color blindness. A specific type of eye chart can be used to test your ability to see color.
Understanding the eye chart can provide a clearer picture of your vision health and allow you to have more informed discussions with your eye care provider. However, remember that the eye chart is just one tool in the toolbox. Comprehensive eye exams are crucial in maintaining eye health and detecting conditions early. As always, consult with your eye care professional if you have any concerns about your vision.


Dr. Steven Liem
Dr. Steven Liem, O.D., F.A.A.O. is an optometrist based in Pasadena, California. After obtaining his doctorate from UC Berkeley’s School of Optometry, he completed his residency in Pediatrics, Vision Therapy & Rehabilitation and became a Fellow of the American Academy of Optometry. When he isn’t busy streaming or making Youtube videos about video games, Dr. Liem aims to broaden accessibility to vision health through his involvement in optometric industry and tech.


 United States